- Forklift Lithium Battery
-
48V
- 48V 210Ah
- 48V 300Ah
- 48V 420Ah (949 x 349 x 569 mm)
- 48V 420Ah (950 x 421 x 450 mm)
- 48V 456Ah
- 48V 460Ah (830 x 630 x 590 mm)
- 48V 460Ah (950 x 421 x 450 mm)
- 48V 460Ah (800 x 630 x 600 mm)
- 48V 460Ah (820 x 660 x 470 mm)
- 48V 500Ah
- 48V 560Ah (810 x 630 x 600 mm)
- 48V 560Ah (950 x 592 x 450 mm)
- 48V 600Ah
- 48V 630Ah
-
48V
- Lithium Golf Cart Battery
- 12V Lithium Battery
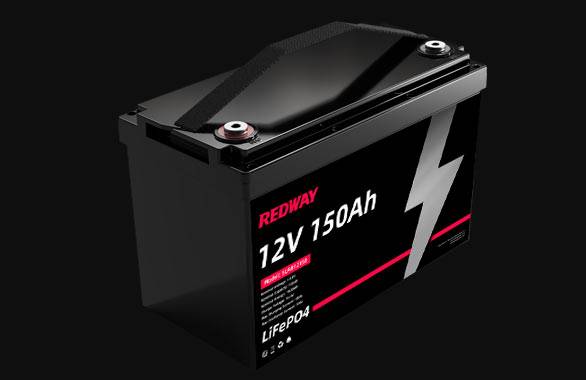
12V 150Ah Lithium RV Battery
Bluetooth App | BCI Group 31
LiFePO4 Lithium
Discharge Temperature -20°C ~ 65°C
Fast Charger 14.6V 50A
Solar MPPT Charging - 24V Lithium Battery
- 36V Lithium Battery
- 48V Lithium Battery
-
48V LiFePO4 Battery
- 48V 50Ah
- 48V 50Ah (for Golf Carts)
- 48V 60Ah (8D)
- 48V 100Ah (8D)
- 48V 100Ah
- 48V 100Ah (Discharge 100A for Golf Carts)
- 48V 100Ah (Discharge 150A for Golf Carts)
- 48V 100Ah (Discharge 200A for Golf Carts)
- 48V 150Ah (for Golf Carts)
- 48V 160Ah (Discharge 100A for Golf Carts)
- 48V 160Ah (Discharge 160A for Golf Carts)
-
48V LiFePO4 Battery
- 60V Lithium Battery
-
60V LiFePO4 Battery
- 60V 20Ah
- 60V 30Ah
- 60V 50Ah
- 60V 50Ah (Small Size / Side Terminal)
- 60V 100Ah (for Electric Motocycle, Electric Scooter, LSV, AGV)
- 60V 100Ah (for Forklift, AGV, Electric Scooter, Sweeper)
- 60V 150Ah (E-Motocycle / E-Scooter / E-Tricycle / Tour LSV)
- 60V 200Ah (for Forklift, AGV, Electric Scooter, Sweeper)
-
60V LiFePO4 Battery
- 72V~96V Lithium Battery
- Rack-mounted Lithium Battery
- E-Bike Battery
- All-in-One Home-ESS
- Wall-mount Battery ESS
-
Home-ESS Lithium Battery PowerWall
- 24V 100Ah 2.4kWh PW24100-S PowerWall
- 48V 50Ah 2.4kWh PW4850-S PowerWall
- 48V 50Ah 2.56kWh PW5150-S PowerWall
- 48V 100Ah 5.12kWh PW51100-F PowerWall (IP65)
- 48V 100Ah 5.12kWh PW51100-S PowerWall
- 48V 100Ah 5.12kWh PW51100-H PowerWall
- 48V 200Ah 10kWh PW51200-H PowerWall
- 48V 300Ah 15kWh PW51300-H PowerWall
PowerWall 51.2V 100Ah LiFePO4 Lithium Battery
Highly popular in Asia and Eastern Europe.
CE Certification | Home-ESS -
Home-ESS Lithium Battery PowerWall
- Portable Power Stations
Comprehensive Guide to LiFePO4 Battery Voltage and Performance

Lithium Iron Phosphate (LiFePO4) batteries have gained significant traction in various high-performance applications due to their stability, safety, and longevity. This guide provides an in-depth analysis of LiFePO4 battery voltage characteristics, charging and discharging parameters, and compares their performance with other battery technologies.
Overview of LiFePO4 Battery Voltage
LiFePO4 batteries are known for their stable voltage output and long cycle life. Their voltage characteristics play a crucial role in determining their suitability for different applications, from electric vehicles to renewable energy systems. Understanding these voltage parameters helps users optimize battery performance and lifespan.
What is a LiFePO4 Voltage Chart?
A LiFePO4 voltage chart illustrates the relationship between the state of charge (SoC) and the voltage across various battery capacities. It provides a clear picture of how the voltage changes as the battery discharges, which is essential for effectively managing and utilizing the battery.
Example Voltage Chart for LiFePO4 Cells
| SoC (%) | 12V Cell Voltage | 24V Cell Voltage | 36V Cell Voltage | 48V Cell Voltage |
|---|---|---|---|---|
| 100 | 14.6V | 29.2V | 43.8V | 58.4V |
| 90 | 13.4V | 26.4V | 39.6V | 52.8V |
| 80 | 13.28V | 26.16V | 39.48V | 52.32V |
| 70 | 13.2V | 26.0V | 39.2V | 52.0V |
| 60 | 13.08V | 25.76V | 38.88V | 51.52V |
| 50 | 13.04V | 25.6V | 38.4V | 51.2V |
| 40 | 13.0V | 25.2V | 38.0V | 50.4V |
| 30 | 12.88V | 24.96V | 37.44V | 49.92V |
| 20 | 12.8V | 24.8V | 37.2V | 49.6V |
| 10 | 12.0V | 24.0V | 36.0V | 48.0V |
| 0 | 10.0V | 20.0V | 30.0V | 40.0V |
Key Parameters
- Nominal Voltage: The average voltage during typical operation. For a 12V LiFePO4 cell, this is 12.8V.
- Float Charge Voltage: The voltage required to maintain a fully charged battery without overcharging. For a 12V cell, this is 14.6V.
- Discharge Cutoff Voltage: The minimum voltage before the battery should be recharged to prevent damage. For a 12V cell, this is 10V.
3.2V LiFePO4 Battery Charging and Discharging Voltage Chart
LiFePO4 cells typically have a nominal voltage of 3.2V per cell. The following chart provides a detailed breakdown of the charging and discharging voltage for 3.2V cells:
| Capacity | Voltage |
|---|---|
| 100% | 3.65V |
| 90% | 3.50V |
| 80% | 3.40V |
| 70% | 3.30V |
| 60% | 3.20V |
| 50% | 3.15V |
| 40% | 3.10V |
| 30% | 3.05V |
| 20% | 3.00V |
| 10% | 2.90V |
| 0% | 2.50V |
12V LiFePO4 Cell Charging and Discharging Voltage Chart
For a 12V LiFePO4 battery, which typically consists of four 3.2V cells connected in series, the voltage characteristics are as follows:
| Capacity | Voltage |
|---|---|
| 100% | 14.6V |
| 90% | 13.4V |
| 80% | 13.28V |
| 70% | 13.2V |
| 60% | 13.08V |
| 50% | 13.04V |
| 40% | 13.0V |
| 30% | 12.88V |
| 20% | 12.8V |
| 10% | 12.0V |
| 0% | 10.0V |
24V LiFePO4 Cell Charging and Discharging Voltage Chart
A 24V LiFePO4 battery, typically composed of eight 3.2V cells in series, exhibits the following voltage characteristics:
| Capacity | Voltage |
|---|---|
| 100% | 29.2V |
| 90% | 26.4V |
| 80% | 26.16V |
| 70% | 26.0V |
| 60% | 25.76V |
| 50% | 25.6V |
| 40% | 25.2V |
| 30% | 24.96V |
| 20% | 24.8V |
| 10% | 24.0V |
| 0% | 20.0V |
36V LiFePO4 Cell Charging and Discharging Voltage Chart
A 36V LiFePO4 battery, consisting of twelve 3.2V cells in series, has the following voltage profile:
| Capacity | Voltage |
|---|---|
| 100% | 43.8V |
| 90% | 39.6V |
| 80% | 39.48V |
| 70% | 39.2V |
| 60% | 38.88V |
| 50% | 38.4V |
| 40% | 38.0V |
| 30% | 37.44V |
| 20% | 37.2V |
| 10% | 36.0V |
| 0% | 30.0V |
48V LiFePO4 Cell Charging and Discharging Voltage Chart
For a 48V LiFePO4 battery, typically comprising fifteen 3.2V cells in series, the voltage characteristics are:
| Capacity | Voltage |
|---|---|
| 100% | 58.4V |
| 90% | 52.8V |
| 80% | 52.32V |
| 70% | 52.0V |
| 60% | 51.52V |
| 50% | 51.2V |
| 40% | 50.4V |
| 30% | 49.92V |
| 20% | 49.6V |
| 10% | 48.0V |
| 0% | 40.0V |
Relationship Between State of Charge (SoC) and Voltage
The State of Charge (SoC) of a LiFePO4 battery directly affects its voltage. As the battery discharges, its voltage decreases. This relationship is not linear, which is why battery management systems (BMS) are used to prevent over-discharge and manage charging efficiently.
Voltage vs. State of Charge Table
| SOC (%) | Voltage (V) |
|---|---|
| 100 | 3.65 |
| 90 | 3.50 |
| 80 | 3.40 |
| 70 | 3.30 |
| 60 | 3.20 |
| 50 | 3.15 |
| 40 | 3.10 |
| 30 | 3.05 |
| 20 | 3.00 |
| 10 | 2.90 |
| 0 | 2.50 |
Charge State Curve
The charge state curve provides insights into how the battery’s voltage changes during charging and discharging. The higher the nominal voltage, the more fully charged the battery is. The curve helps in understanding the battery’s charge and discharge characteristics.


